
Giving USA 2020: The Annual Report on Philanthropy for the Year 2019 has just been released. It reports that Americans gave almost $450 billion to charity in 2019, meaning that last year was the third consecutive year of the highest levels of total giving ever recorded.
Giving USA is the longest-running, most comprehensive report on philanthropy in the United States. It pulls together data from 53 million households, 16 million businesses, over 1.4 million non-profits (inclusive of religious organisations), over a million estates, and 82,000 foundations. The report is presented by two organisations: the fundraising professionals at Giving USA Foundation, a public service initiative of The Giving Institute (AskRIGHT is a member of The Giving Institute), and the research team at The Indiana University Lilly Family School of Philanthropy.
The burning question on everyone’s mind, considering all that has happened in 2020: what can 2019 figures indicate for the future of philanthropy for your organisation in the uncertain environment of 2020 and beyond? It is not yet known what the economic impact of unprecedented global monetary and fiscal policy responses to the COVID-19 pandemic will be. Giving USA 2020 offers 40 years of trend data, including the Great Recession years, to give us a better sense of what patterns may be changing in giving, both in the larger picture and in the longer run. Highlighted here are three major themes from the results, some indicators of possible trends, comparisons with specific economic factors, and key take-aways.
TOP HIGHLIGHTS
Giving USA 2020 details three major themes that emerged from the results:
- Americans gave $449.64 billion to charity in 2019 (one of the highest years for giving on record) and growth in total giving was driven by individual giving
- Growth in giving was largely due to positive US economic conditions in 2019
- Giving from three out of the four sources and giving to all but one of the nine major types of recipient charitable organisations grew in 2019
WHAT ARE THE TRENDS IN TOTAL GIVING?
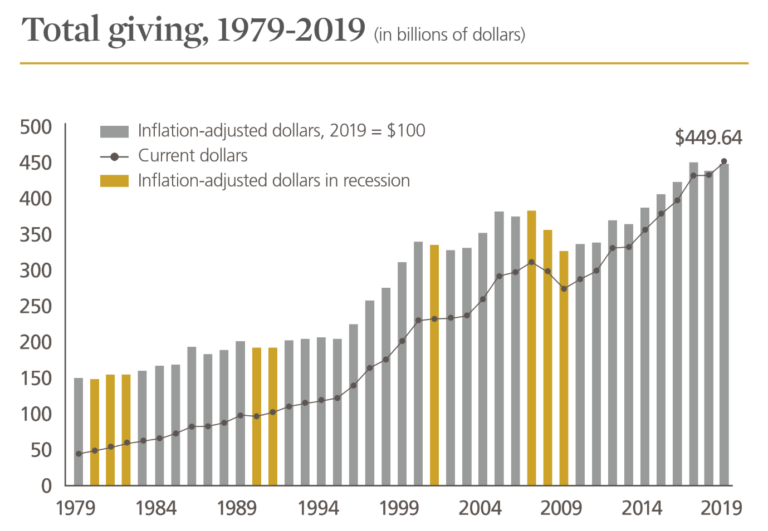
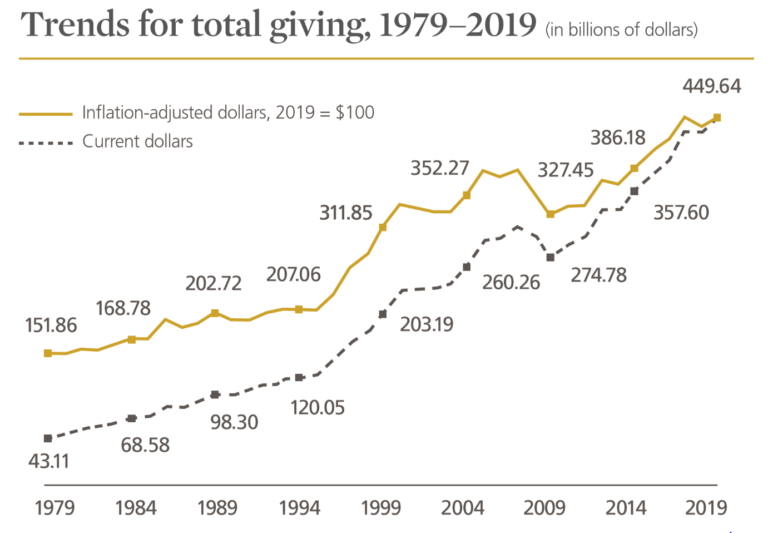
Total giving in the United States in 2019 reached nearly $450 billion, representing a 4.2% increase from the previous year (2.4% increase when adjusted for inflation). The last three years – 2017, 2018, and 2019 – reported the three highest levels of total giving ever recorded. In 2019, all giving sources were giving at either an all-time or second all-time high. On the recipient side of giving, of the nine charitable causes or “subsectors” into which recipients are categorised, all but three exceeded their previous highs.
Taking a step back, the last 40 years of Giving USA data provides some insight into long-term trends and how philanthropy has responded to crises in the past. Adjusted for inflation, total charitable giving has declined nine times since 1979. The Great Recession (also known as the Global Financial Crisis) had a major impact on total giving from 2007 to 2009, falling 12% in two years (15.2% when adjusted for inflation), a 3.7% decrease in 2008 (7.2% decrease inflation-adjusted), and a further 8.3% decrease in 2009 (8% decrease inflation-adjusted).
The average year-to-year change in total giving between 1979 and 2019 was an increase of $10.16 billion ($7.44 billion when adjusted for inflation), making the change in total giving between 2018 and 2019 larger than the 40-year average. The slowest 10-year period of growth for total giving was from 2000 to 2009, representing a 20% increase (a 4% decrease when adjusted for inflation). For the most recent decade, 2010-19, the total growth in inflation-adjusted giving was 33%.
(Source: Giving USA Foundation, Giving USA 2020)
WHY HAS TOTAL GIVING BEEN AT RECORD LEVELS?
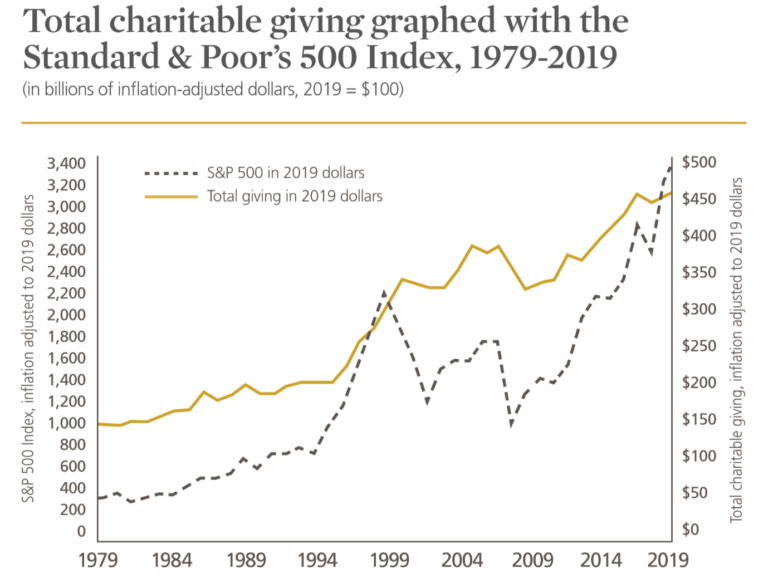
Key economic factors associated with total charitable giving include disposable personal income, stock market performance, and gross domestic product (GDP). In 2019 many of these indicators posted strong growth: personal income grew by 4.3% (a little less than the 6.1% growth seen between 2017 and 2018), the Standard & Poor’s 500 Index (S&P 500) grew by 28.9%, and GDP grew by 4.1%. Overall, the US economy was strong in 2019, though high growth in GDP can be an indicator for overheating. There was some nervousness about the economy hitting a possible peak in the business cycle before possibly contracting into recession in 2019 or 2020.
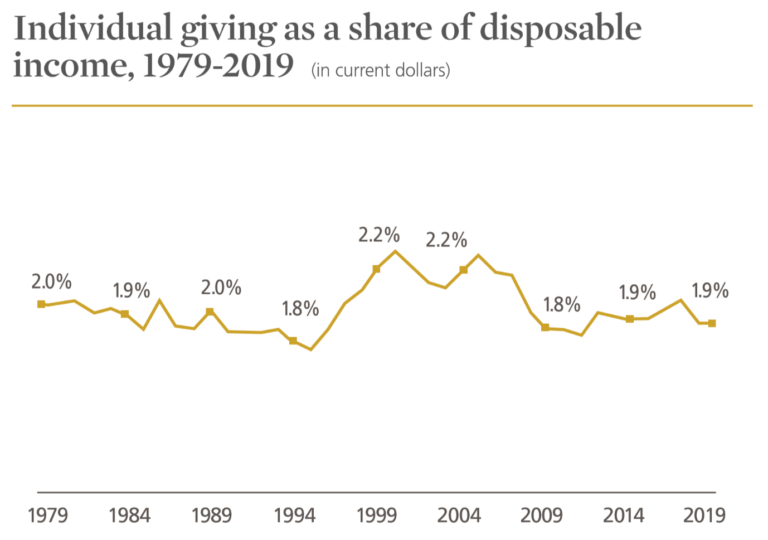
In 2019, individual giving as a percentage of disposable income stayed level with the previous year at 1.9%. This measure has remained relatively steady over the last 40 years, reaching a low of 1.7% in 1995 and a high of 2.4% in 2005.
(Source: Giving USA Foundation, Giving USA 2020)
There is a statistically significant correlation between charitable giving and performance of the stock market, with individuals and corporations more likely to give when the stock market is up. However, changes in charitable giving tend to lag slightly behind and are generally less dramatic than changes in the stock market. Total giving as a percentage of GDP in 2019 was 2.1%, hovering around at least 2% since 2012, and for most of the 2000s before that.
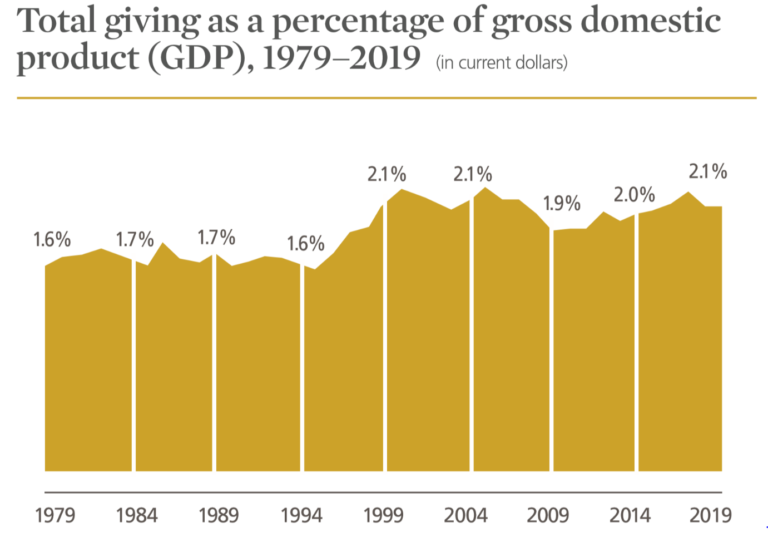
(Source: Giving USA Foundation, Giving USA 2020)
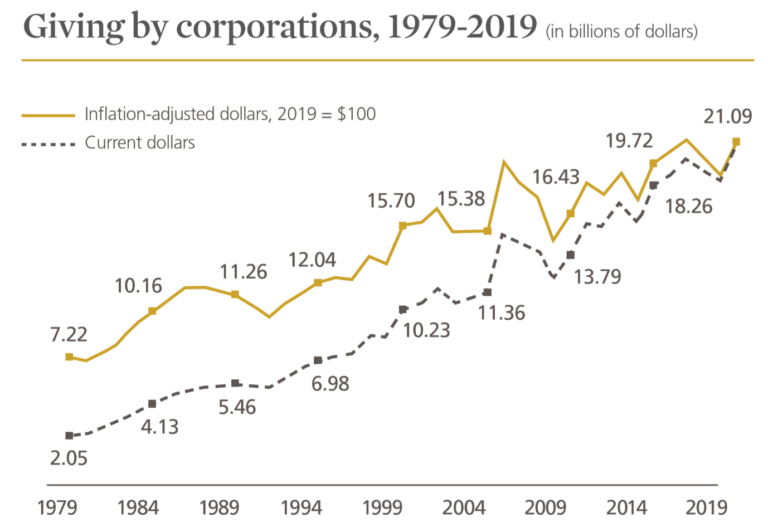
Corporate giving as a percentage of corporate pre-tax profits has averaged 1.1% over the last 40 years. Again, there is a significant correlation between corporate pre-tax profits and changes in corporate giving. In 2019, the combination of a 4.1% increase in GDP and steady corporate pre-tax profits had a positive effect on corporate giving, with giving from this source reaching its highest level since 2003.
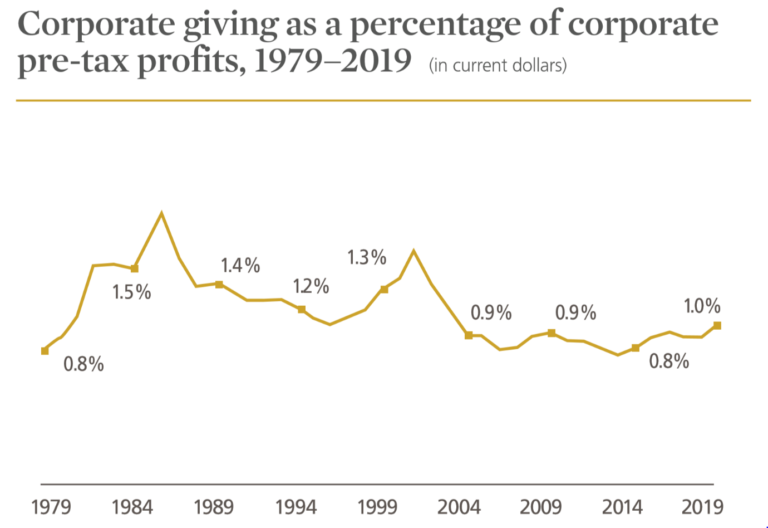
(Source: Giving USA Foundation, Giving USA 2020)
WHERE DID THE MONEY COME FROM?
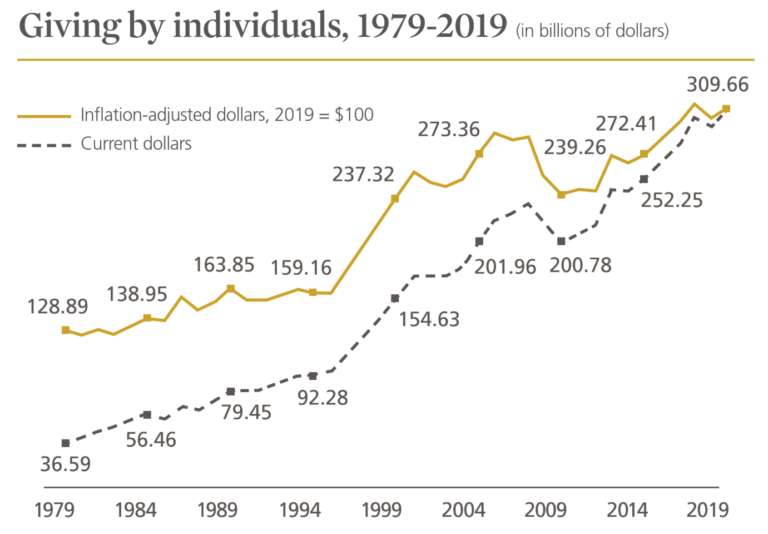
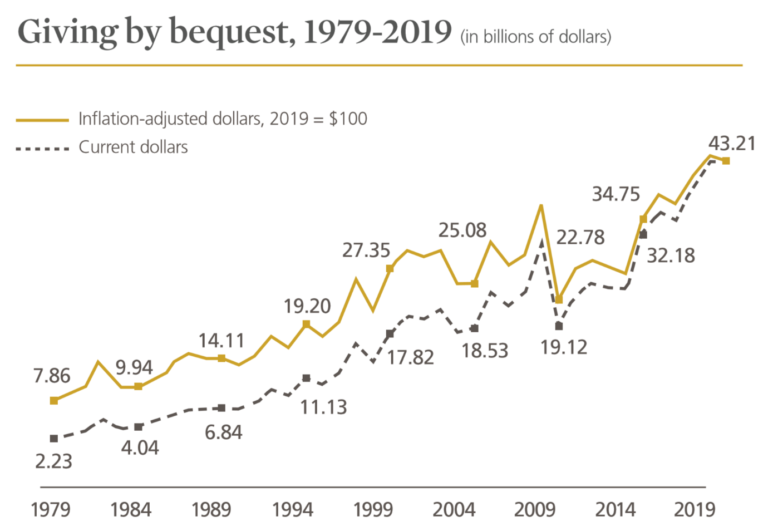
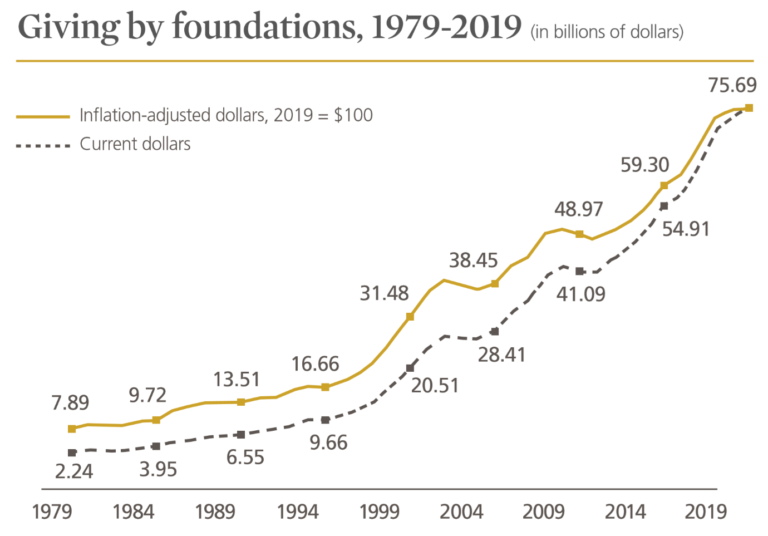
The majority of total charitable dollars in 2019 came from individuals, at just under 70% of total giving. Overall, there was growth in most sources of charitable dollars in 2019: giving by corporations increased by 13.4% (11.4% when adjusted for inflation) from the previous year, giving by individuals increased by 4.7% (2.8% when adjusted for inflation), and giving by foundations increased by 2.5% (0.7% when adjusted for inflation). Giving by bequests was the one source that remained flat, at 0.2% (or a 1.6% decrease when adjusted for inflation).
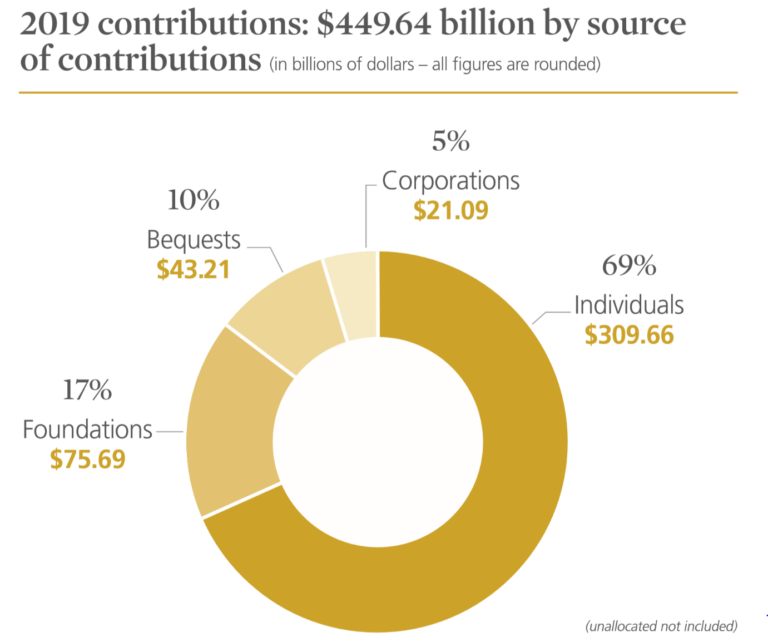
Source: Giving USA Foundation, Giving USA 2020)
Taking a step back to view the last 40 years of trend data shows that, long term, giving by individuals has reduced substantially as a percentage of total giving, while giving by foundations has grown steadily over this same period.
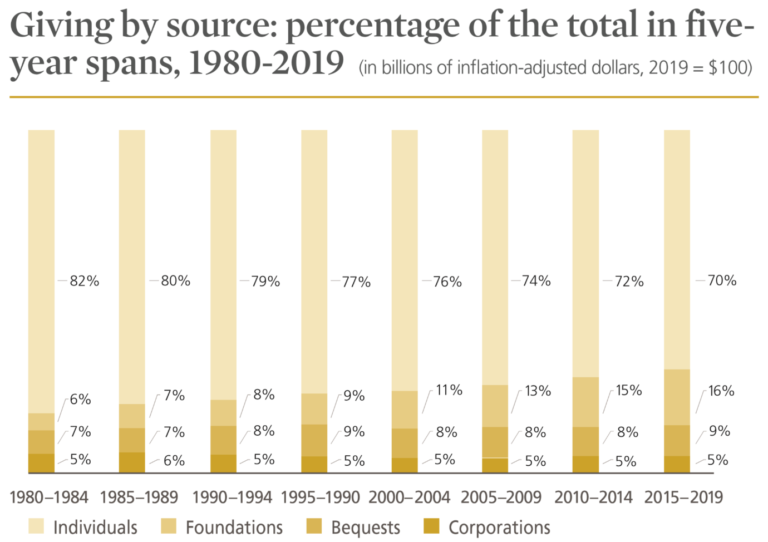
(Source: Giving USA Foundation, Giving USA 2020)
The Great Recession had a major impact on total giving from 2007 to 2009, as already mentioned. Giving by individuals was particularly affected. From 2007 to 2009, giving by individuals fell 14.4% in two years (17.4% when adjusted for inflation): an 8.3% decrease in 2008 (11.6% decrease inflation-adjusted) and a further 6.1% decrease in 2009 (5.8% decrease inflation-adjusted).
Despite the trend of a slow but steady decrease in individual giving over the last four decades, estimated charitable giving by individuals (and households) was still a sizeable $309.66 billion in 2019 (as stated earlier, an increase of 4.7% from 2018, or 2.8% when adjusted for inflation).
Giving USA 2020 reports that very large “mega-gifts” totalled $3.17 billion in 2019. The Chronicle of Philanthropy’s annual Philanthropy 50 list has also reported a record-breaking year from the super wealthy in 2019. The top five donors in the United States each gave more than $1 billion to charity (some of these gifts were given as bequests). This is the first time ever in the 20-year history of the Philanthropy 50 list that so many individuals have given at this level. Businessman and politician Michael Bloomberg gave $3.3 billion; hotel magnate (late) Barron Hilton left $2.4 billion to his father’s foundation; former Google CEO Eric Schmidt together with his wife Wendy gave over $1.3 billion; Walmart heir Jim Walton gave over $1.2 billion; and donor (late) Thomas Lord left gifts totalling over $1 billion. These top five donors all together gave an eye-watering total of $9.3 billion, more than the total giving for the entire Philanthropy 50 list in 2018. Fighting climate change and fighting inequality were popular charitable causes with wealthy individuals in 2019.
(Source: Giving USA Foundation, Giving USA 2020)
Charitable giving by bequest in the United States reached $43.21 billion in 2019:
- $21.37 billion came from estates with assets $5 million or more
- $7.01 billion came from estates with assets between $1 and $5 million
- $11.34 billion came from estates with assets below $1 million
(Source: Giving USA Foundation, Giving USA 2020)
From 2018 to 2019, giving by foundations grew to an estimated $75.69 billion, an increase of 2.5% (only a small increase, 0.7% when adjusted for inflation). Over the same period, giving by corporations grew to an estimated $21.09 billion, a big increase of 13.4% (11.4% when adjusted for inflation).
(Source: Giving USA Foundation, Giving USA 2020)
(Source: Giving USA Foundation, Giving USA 2020)
WHO RECEIVED THE MONEY?
Last year, the largest share of charitable dollars by a considerable margin went to religious organisations (29%), followed relatively far behind by education (14%). Grant-making foundations received 12% of total charitable dollars.
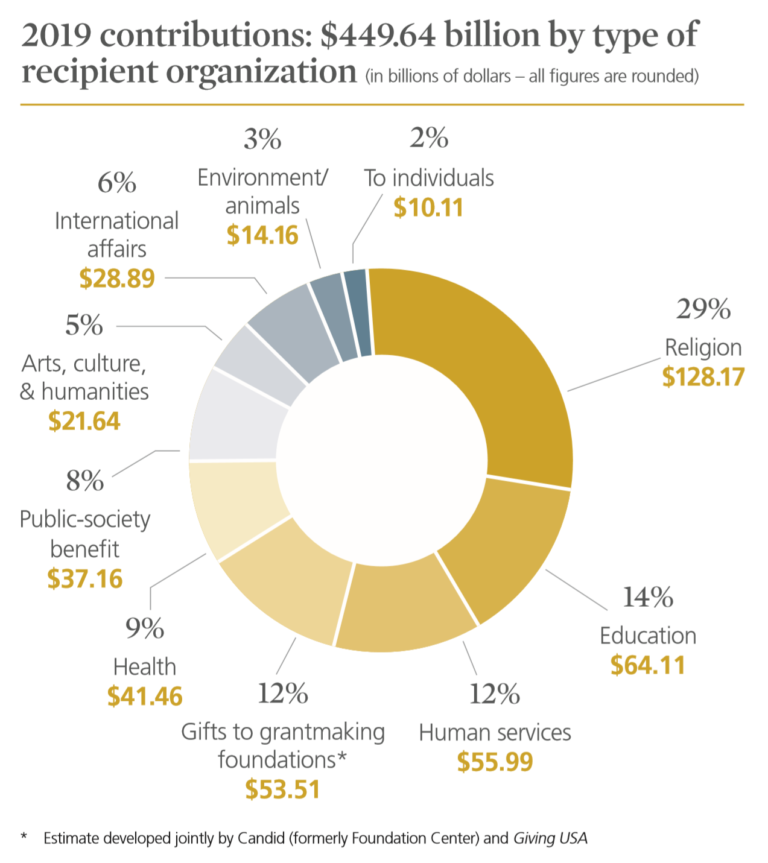
(Source: Giving USA Foundation, Giving USA 2020)
Contributions to eight of the nine charitable subsectors grew in 2019. In current dollars, the two-year growth rate was positive for all nine subsectors, and four of these subsectors saw double-digit growth year over year:
- Public-society benefit increased by 13.1% (11.1% inflation-adjusted)
- Arts, culture & humanities increased by 12.6% (10.6% inflation-adjusted)
- Education increased by 12.1% (10.1% inflation-adjusted)
- Environment and animal-related causes increased by 11.3% (9.4% inflation-adjusted)
After a strong two-year run, international affairs is the only subsector that was flat in 2019.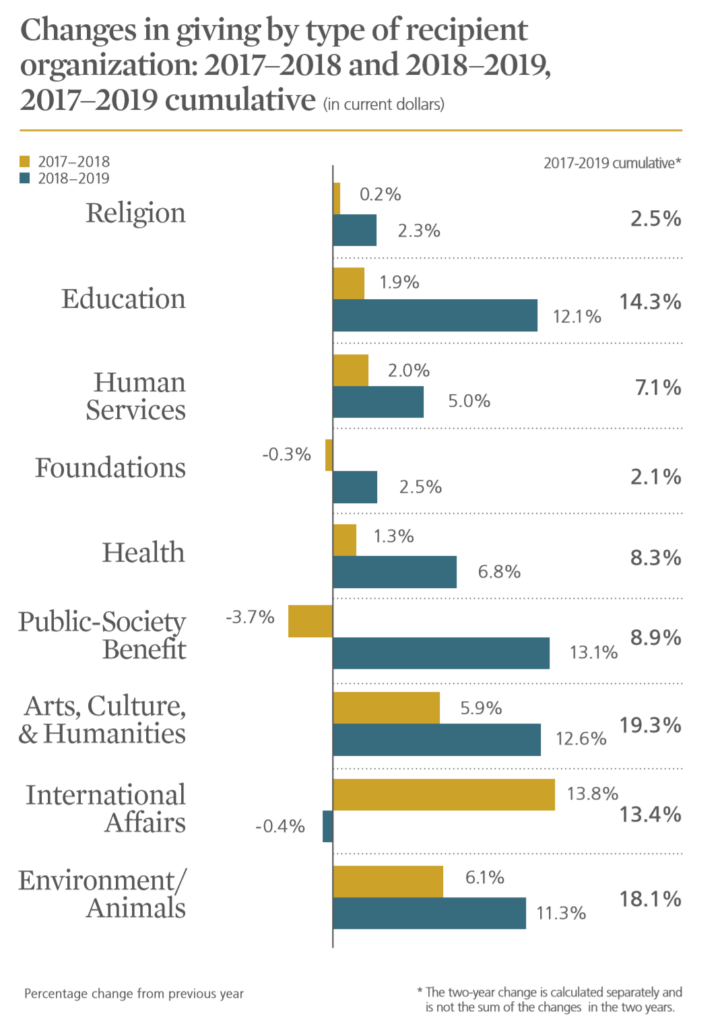
(Source: Giving USA Foundation, Giving USA 2020)
IS 2019 STILL IMPORTANT IN 2020?
Part of planning is understanding where we came from to get to where we are now. We can learn from the 40 years of trend data available in Giving USA 2020; the context the data provides can help inform our long-term strategy and recovery plans for philanthropic efforts here in Australasia.
Trend data on the changing shape of charitable giving in Australasia echoes many of the US trends highlighted in Giving USA 2020. Key reports from JBWere are the Support Report 2018 (June 2018), which analyses trend data from the last 20 years of charitable giving in Australia, and the New Zealand Support Report (February 2020), developed in collaboration with Philanthropy New Zealand, which looks back at charitable giving in New Zealand in the year 2018. The Australian Financial Review’s latest Philanthropy 50 list shows record-breaking growth in giving by Australia’s biggest philanthropists in 2019, rising from $554 million to $748 million in one year, an increase of 35%.
Giving USA 2020 tracks both overall giving and giving in your particular subsector over time in relation to the US economy. In 2020, two areas of high-level importance to consider in the context of the economy include momentum coming out of 2019 and historical context:
- Momentum: there was a strong tailwind moving in 2020 and growth in charitable giving to causes such as the arts, education, and the environment were markers of success
- Historical context: the report shows 40 years of data trends, so we can look at how philanthropy has responded in previous times of crisis and in the longer run
WHAT NEXT FOR 2020 AND BEYOND?
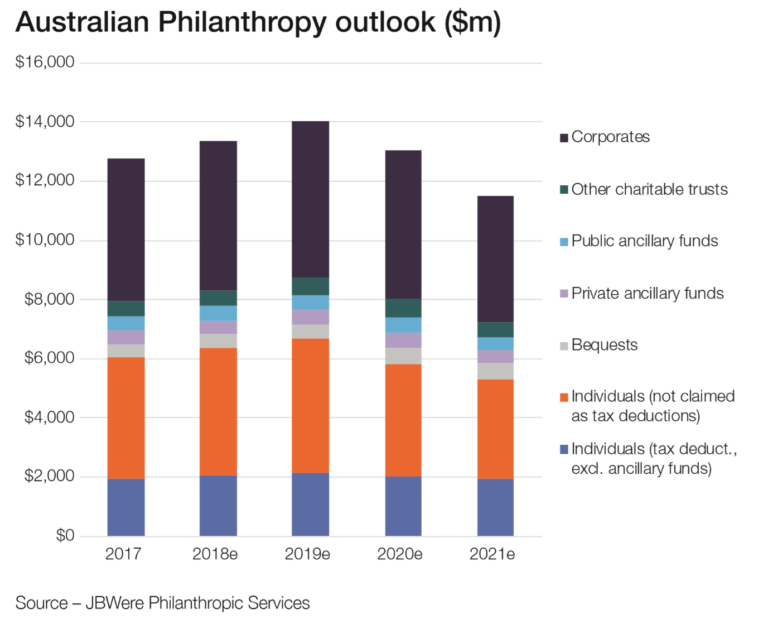
JBWere’s latest report on the outlook for philanthropy in Australia, Where to from here? The outlook for philanthropy during COVID-19, was released in April 2020. This report estimates that total giving in Australia will drop about 7.1% this year, and then again in 2021 by a further 11.9%.
Fundraisers must respond to the current uncertain environment. The full economic impact of unprecedented global monetary and fiscal policy responses to the COVID-19 pandemic in 2020 and beyond is yet to be known. There was a favourable environment for charitable giving in 2019. Now, in 2020, all eyes will be on economic indicators of charitable giving such as unemployment rate, disposable income, stock market performance, and GDP.
As you plan your response to the current uncertain environment, think about how you position your organisation to come out of this crisis. Historically, donors have responded to areas of need. Making the case for your organisation and connecting with donors will become even more important. Donor retention is an area to give some focus to at this time. Finally, consider the potential that technology has to play an important role in navigating our new landscape.
Get the full Giving USA 2020 report here